Intro
The first sentence of each blog post is always the hardest. Whew! Glad that is out of the way. Movin’ on!
Part of me wants to skip or delay this post – as I have it on good authority that the Italians are going to write this up for us. And they actually understand this, where I stumbled onto this and was completely confused, flabbergasted, perplexed, baffled and mystified! (I may have pulled out the thesaurus, but you can’t prove it). But, I can’t get it out of my head either… so here we go!
This will take a bit of review first, but as some old dude said: “People need to be reminded more often than they need to be instructed.”
Relationships Have Direction

I have a super simple model. These two tables are tied together by a Name primary key. The lookup table has an Age, and apparently I have a column called “SomeValue”, and measures [Total SomeValue] := SUM(Facts[SomeValue) and [Total Age] := SUM(Names[Age]).
So, can you look at this Pivot Table and guess why the Ages look wrong?

Pretty much any time you see repeated values like this you are thinking “Those values are NOT being filtered”. Here it is because the Row labels were drug in from the Facts table, instead of the Lookup table (Names). As such, the Age column (which is on the lookup table) isn’t being filtered… because the filters only flow from the Names (lookup / one-side) to the Facts (fact / many-side) of the relationship. Relationships have direction…
Aggregate Functions With and without Filter Context

Okay, so… we throw a calculated column on our Facts table. =SUM(Facts[SomeValue]) and the results are vaguely weirdish (at right). The reason is that there is no filter context, so the SUM is operating on the whole table.
Now, if we simply wrap the formula in a calculate, we get something different… because the CALCULATE function has the impact of converting a row context into a filter context.
=CALCULATE(SUM(Facts[SomeValue])). Results below.
 Hmmmmm. So… ok. Most of the rows look like what I expected. We stopped running a SUM on the entire table… so, we apparently have a filter context, but that blank on Joci is kinda weird. That is our first inclination that… something is going on here that isn’t quite expected.
Digging Further Into Context Transition

I have added just 2 more rows. Another Leanne row, and another Rob row. However, Leanne got a unique value for her SomeValue (77), where Rob got a duplicate value (66 again).
And the results are interesting. Leanne maintains a sort of “per row” looking filter context, and just get a new 77 calculated column. But that tricky Rob… because every column for him was identical… his filter context includes BOTH rows on his calculated column… adding his two 66’s to get a 132. In both rows.
So, what we learned is that the filter context created by CALCULATE is not some magic “I only filter down to THIS row”, rather it just has… Name=Rob, SomeValue=66, etc… for each column. And it can very much match multiple rows.
Now about that Joci… the thing is, she is not in the lookup table. I’m so trixsy. But like… why would that matter? At all? I mean… it’s not like we are doing anything with that lookup table. We are just walkin’ the fact table doing some calcs. Why is it even doing a lookup!? We are still weirded out at this point.
Row Context, Lookup Tables and Blown Minds
Before I continue, one minor point that I’m not going to paste a pretty picture for… just take my work for it. Measures (Calculated Fields) have an implicit call to the CALCULATE function. They do the magic context transition from Row to Filter, regardless of if the CALCULATE function is actually called.
Okay, so I am going to define 2 measures here:
[Fact Rows]:=COUNTROWS(Facts)
[Name Rows]:=COUNTROWS(Names)
And drop them onto our fact table… and check what happens.

Okay, the FactRows… looks like what I would expect based on our previous learnin’. But… those NameRows? Those are from the lookup table (the “one” side of our one to many), and we had tried to say that “Filters Have Direction” – heck there was a whole section of this blog entry on it. And it shows the same value for every row when using rows out of the fact table. Which is totally what we are doing here. Wha?
So… that is the weird and Mind Blowing new learning. During context transition (converting row context to filter context)… the new filter context will follow to the one side of all relationships (what we like to call the Lookup tables). Which… totally feels like a filter flowing in the opposite direction of we typically expect. Or at least… what *I* expect.
I am going to add one more fact table just to demonstrate these filters also flow “back down” in the typical direction of lookup table down to fact table. Which is neat. I think 
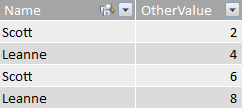
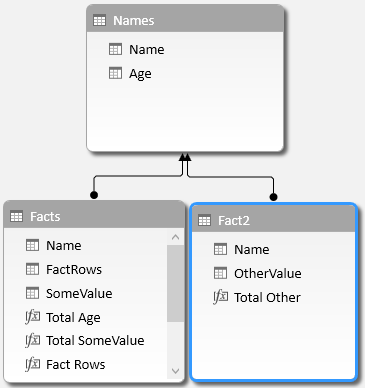
So, the structure looks really typical. One fact table is filtering two different fact tables. What what we are going to see… is that when adding a calculated column on the Facts table, the freaky context transition will allow us to pull values from Fact 2… that correlate to our primary key. Without writing ANY custom filtering code. It just magically works, which… is awesome or scary or something.
The new measure is just: [Total Other] := SUM(Fact2[OtherValue]). And I drop it on our (original) Facts table, and check these results.  Since only Leanne and Scott were in the Fact2 table I pasted above (aaaaah, cute… we are probably kissing and stuff!) only the Leanne and Scott rows get values in our original Fact table where we dropped this new calc column.
So, we start from the (left) “Facts” tables and on the context transition we filtered the Lookup table (the “Names” table on the one side of the one to many), and then THAT filtered down into the (right) “Facts2” table… giving us… well, I would say… the values we wanted, but maybe not what we (or at least I) expected when I first saw this.
Wrap It up!
That’s pretty much a wrap. The only other thing I will say is that… this doesn’t only happen when doing calculated columns. That may be the most common place to think about this row to filter context transitions… but they can also happen on any of the iterator functions that create a row context… say, SUMX() or FILTER(). I kind of want to pretend I don’t know that… cuz I am barely holding these concepts in my head as it is.
And… I should probably mention that… this is advanced stuff, in my option. If you don’t understand it… I wouldn’t stress it. I have built MANY models and gotten tremendous insights… without understand this… at all.
For now, I am going to back-burner this. Keep enough awareness so that when weird stuff happens I can say … “oh yaaaaa…. there was that weird filtering behavior I didn’t really expect…” and go about my happy life.
If you love this though, be on the lookout for a post from the Italians. I suspect they are busy traveling to MVP Summit and PASS 2014 right now… but Marco promises he is going to write this all up, since it has come across his desk a few times. Likely it will be a more thorough treatment… I know I am looking forward to it

- The streak is alive! – August 10, 2017
- DAX KEEPFILTERS Plus Bonus Complaining! – July 20, 2017
- VAR: The best thing to happen to DAX since CALCULATE() – July 11, 2017
- Review: Analyzing Data with Power BI and Power Pivot for Excel – June 20, 2017
- Power BI Date Table – June 2, 2017
Scott Senkeresty here… Founder and Owner of Tiny Lizard. Yes, I have done some stuff: A Master’s Degree in Computer Science from California Polytechnic State University in beautiful San Luis Obispo, California. Over twelve years developing software for Microsoft, across Office, Windows and Anti-Malware teams… Read More >>
Hey!
This should work at least for everything except subtotals and grand totals:
=IF(HASONEVALUE(Fact[Name]),
SUMX( FILTER( ALL(DIM),
DIM[Name]= VALUES(Fact[Name])),
DIM[Age]),
BLANK()
)
@EscobarMiguel90
Hi MIguel. There wasn’t really a specific measure I wanted to show here — rather my updated understanding of how “filters” (probably not exactly the right term here) are applied when converting a row context to a filter context. The point was that the filter context created… spans multiple tables.
Got it!
out of nowhere I just felt the need to write that custom dax formula 🙂
This one works at every level:
SUMX( CALCULATETABLE( DIM, Fact), DIM[Age])
One fact table is filtering…
?
One dim table is filtering… Do I understand this?
Typical thinks would be that dim tables… filter fact tables. This *feels* like the opposite. Which is… probably not exactly correct. I’m sure on the covers it is more like “when a row context is converted to a filter context, it does so by doing a JOIN on all tables first”… which this being a “side-effect” (though, I think a positive side effect).
Nice article! Jeffrey Wang had a thorough explanation of cross- filtering; http://mdxdax.blogspot.fr/2011/03/logic-behind-magic-of-dax-cross-table.html?m=1
The short version is: the fact table “includes” all columns from the dimension.
Fun fact: This also works with ALLEXCEPT.
Scott, following Jeffrey Wang’s explanation of how cross table filtering works: “The best way to understand DAX cross table filtering is to think of each base table as extended by its related tables”, I decided to use sql to reproduce the tables that you created and the effect of adding DAX formulas on calculated columns.
On each select query, the outer select query represents the base table and the subquery represents the DAX formula. Within the subquery you can see the relationship via inner join between the base table and the related or lookup table and how later that subquery (as Jeffrey explains) is left outer joined with the base table. I like to think that what we see on each select subquery and query is more or less the 4 step process that Calculate performs in a very small scale, but to be sure I would need to experiment more not only with calculated columns but with calculated fields.
create table #Facts (Name varchar(30), SomeValue int)
insert into #Facts
values (‘Chris’, 33),
(‘Joci’, 55),
(‘Leanne’, 44),
(‘Rob’, 66),
(‘Scott’, 22),
(‘Leanne’, 77),
(‘Rob’, 66);
select * from #Facts
–drop table #Facts
————————————————
create table #Names (Name varchar(30), Age int)
insert into #Names
values (‘Chris’, 35),
(‘Leanne’, 50),
(‘Rob’, 33),
(‘Scott’, 45);
select * from #Names
–drop table #Names
——————————————————-
create table #Fact2 (Name varchar(30), OtherValue int)
insert into #Fact2
values (‘Scott’, 2),
(‘Leanne’, 4),
(‘Scott’, 6),
(‘Leanne’, 8);
select * from #Fact2
–drop table #Fact2
——————————————————
select
f.Name
,f.SomeValue
,x.SumSomeValue
from #Facts f
left outer join
(select ff.Name, ff.SomeValue, sum(ff.SomeValue) SumSomeValue
from #Facts ff inner join #Names n on ff.Name = n.Name
group by ff.Name, ff.SomeValue) x
on f.Name = x.Name and f.SomeValue = x.SomeValue
order by f.Name
——————————————————-
select
f.Name
,f.SomeValue
,x.FactRows
,y.NameRows
from #Facts f
left outer join
(select ff.Name, ff.SomeValue, count(*) FactRows
from #Facts ff inner join #Names n on ff.Name = n.Name
group by ff.Name, ff.SomeValue ) x
on f.Name = x.Name and f.SomeValue = x.SomeValue
left outer join
(select n.Name, count(*) NameRows
from #Names n
group by n.Name) y
on f.Name = y.Name
order by f.Name
——————————————————-
select
f.Name
,x.TotalOther
from #Facts f
left outer join
(select ff.Name, sum(ff.OtherValue) TotalOther
from #Fact2 ff inner join #Names n on ff.Name = n.Name
group by ff.Name) x
on f.Name = x.Name
order by f.Name