Happy 2015 Power Pivot Freaks! Should be an exciting year as Microsoft seems intent on pushing forward with its self-service BI strategies and the Power BI stack. I suspect we will see a new version of Office this year, so I will be excited to see which of my dreams come true.
Today I wanted to talk a bit about the CONTAINS() function. The msdn reference gives one example, but it’s a bit rough to come up with scenarios where it’s really applicable. I saw a great example from Chris Webb (@technitrain) for an “events in progress” problem… and that comes up pretty frequently; I suspect using CONTAINS() against dates is going to be a useful technique.
I suspect that situations where you don’t have a relationship between tables and you are trying to “fake” the relationship is when it will come up.
Example
 The best I can come up with just one cup of coffee is when two cities per row of my fact table. My fake data is going to be for shipping data… the cost from some city and to some city. (though, I suspect this could also apply nicely to double entry book keeping – where you have the from/to accounts).
Assuming we had a Cities lookup table, it’s not really clear which column we would relate… the from or the to? Actually, let’s say you wanted a pivot table that shows all the From/To, and was sliceable by city. If you slice Denver… you want to see everything into and out of Denver. So a relationship on From/To isn’t going to help.

Okay, so we want this fancy From/To chart. We want to slice on it. I think we do wants a lookup table of cities, because it is possible that a given city doesn’t show up in both (nobody ships to Austin, nobody from from New York), and we have established that a relationship doesn’t really help us.
So… how are we going to write a measure that fakes this relationship and let’s us filters such that slicing on Denver shows both stuff in and out of Denver?
The Less Good Way – VALUES( )
TotalCost := SUM(Freight[Cost])
Well, fine, we have a base measure. But that obviously doesn’t help us filter by City. Here is what I would typically do.
SelectedCity := IF (HASONEVALUE(CityLookup[Name)), VALUES(CityLookup[Name]))
FilteredTotalCost := CALCULATE([TotalCost], FILTER(Freight, Freight[To] = [SelectedCity] || Freight[From] = [SelectedCity] || [SelectedCity] = BLANK()))
There is nothing wrong with this technique. Well, assuming it is correct – I didn’t actually type this into Excel to test it.  But theoretically, it works great as long as you select exactly one city to filter. The [SelectedCity] measure checks for that via HASONEVALUE. Alternatively, you can probably do some sort of MIN/MAX (well, technically you can’t do that on strings, but you can fake it with FIRSTNONBLANK). And this is all because we are walking the Freight table (our fact table) via that FILTER() call and checking to see if either the Freight[To] or Freight[From] equals whatever was selected.
What we would actually like to do is include any rows from the Freight table that has To/From in the list of cities that we sliced – potentially more than one. I suspect if we thought hard we could come up with a way to do that involving some sort of COUNTROWS(FILTER()) > 0 … but I’m scared. Instead, let’s look at CONTAINS( ) since it does exactly what we want
The More Good Way – CONTAINS( )
Sample, from the MSDN page: =CONTAINS(InternetSales, [ProductKey], 214, [CustomerKey], 11185)
That is pretty easy to read, I think. It returns TRUE if the InternetSales table has a [ProductKey] of 214 and [CustomerKey] of 11185. I have to admit that reads quite a bit like IF (COUNTROWS(FILTER(InternetSales, [ProductKey]=214 && [CustomerKey] = 111185)) > 0, TRUE(), FALSE()) … might be syntax sugar, not sure.
So, let’s apply that to our freight cost measure:
FilteredTotalCost := CALCULATE (

     [TotalCost],

     FILTER (

         Freight,

         CONTAINS(VALUES(CityLookup[City]), CityLookup[City], Freight[To]) ||

         CONTAINS(VALUES(CityLookup[City]), CityLookup[City], Freight[From])

     )

 )
Which… also seems relatively reasonable to me. Let’s look at just CONTAINS(VALUES(CityLookup[City]), CityLookup[City], Freight[To]). We know it returns a TRUE/FALSE, which is great… because that is what FILTER wants. VALUES(CityLookup[City]) will return a table of just the unique [City] that are selected in our slicer. And, it is looking up the Freight[To] to see if that is in that list of selected cities.
So, the whole measure basically says “Hey, calculate the total cost for all freight (in the current filter context) filtered by… the Freight[To] or the Freight[From] is in the selected cities from our slicer”.
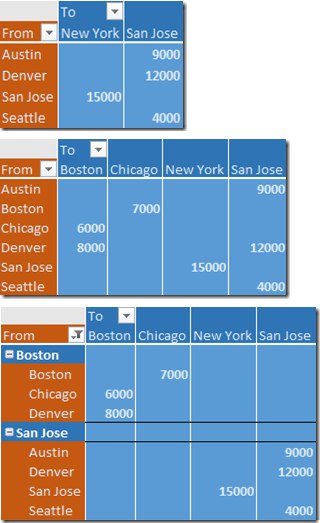
And sure enough, if I slice San Jose (top table at left)… I get both the stuff shipping out of San Jose and shipping into San Jose. If I slice both San Jose and Boston I get the 2nd chart, which includes To/From for both San Jose/Boston! If so inclined, I can drag CityLookup[City] onto rows of my pivot table to make it a bit more clear which cells are related to Boston vs San Jose, but the actual cell values are certainly identical.
Wrap Up
My general sense is this pretty useful for “Is this list of stuff in that list of stuff?” and I do think you could probably go through life and not worry about this function – much like LOOKUPVALUE. There are just other ways to do it. But both of them certainly look nicer which isn’t the worst thing ever.
Hopefully, even if you didn’t really care about cities or even the CONTAINS function, I hope some of the newer folks sorta got a feel for why you don’t always create a relationship – just because you can. It doesn’t always make sense. StartTime/EndTime, To/From, OrderDate/ShipDate, … maybe it makes sense… and maybe it doesn’t. You need to think through some of these.
Edit:
Here is a link to the Excel 2013 Workbook I used to create this post.

- The streak is alive! – August 10, 2017
- DAX KEEPFILTERS Plus Bonus Complaining! – July 20, 2017
- VAR: The best thing to happen to DAX since CALCULATE() – July 11, 2017
- Review: Analyzing Data with Power BI and Power Pivot for Excel – June 20, 2017
- Power BI Date Table – June 2, 2017
Scott Senkeresty here… Founder and Owner of Tiny Lizard. Yes, I have done some stuff: A Master’s Degree in Computer Science from California Polytechnic State University in beautiful San Luis Obispo, California. Over twelve years developing software for Microsoft, across Office, Windows and Anti-Malware teams… Read More >>
Hello, am not sure if I followed correctly because I failed to create a model based on your explanations.
Might you have a small example?
Thanks and wishing you a happy new year!
Let me see if I can find it… or create a new one 🙂 I should get better about that…
I see what happened. I developed the workbook calling the table “Cities”, but decided while blogging to call it CityLookup, since I thought that made it easier to read. I changed the dax while writing the blog entry… but didn’t catch them all. My bad! 🙁
Added link to end of post.
I was a bit confused because I thougth you were using two lookup tables with city names. In your measure above you typed “CONTAINS(VALUES(CityLookup[City]), Cities[City], Freight[To])” but when I looked into the excel file you have only one look up table: “CONTAINS(VALUES(Cities[City]), Cities[City], Freight[To])”.
Ok, I just realized that you wrote a comment about the change you made to the measure. Great blog post!
Do you know how to perform a distinct count when a separate column contains a string?
My data example is:
1213 sat
1014 gef
1456 sat,gef
1213 sat,gef
1213 gef
I want to count how many distinct values are in the first column where the 2nd column contains “gef”. i.e. the answer would be 3.
1014
1456
1213
I tried this but it didn’t work:
CALCULATE(DISTINCTCOUNT[column1]),isnumber(SEARCH(“gef”,database[column2],1))=TRUE())
I would need more info than “it didn’t work” I guess, since your measure seemed to work for me. (sat gives 2, gef gives 3, which feels correct to me…?)
Also feel free to hit me up Mr Excel’s powerbi forum, I hang out there answering questions. Up to 850 replies! 🙂
The way I deal with such things is… to have two identical tables of cities, one called FromCity and the other one – you guessed it – ToCity. Then you join them to the relevant fields and you can easily slice and dice and create all kind of pivots, even ones you couldn’t make with just one Cities table. All without any stunts in the DAX code. Same goes for dates. Many transaction level data tables store many different dates. With one date table you have to have inactive relationships in the model and be careful how you design the measures; still you won’t be able to perform some kinds of analyses. With role-playing date table (actually many physical copies of the same table but with different names) the world is so much easier 🙂 And after all, how many cities are there in the world? A finite number for sure.